

Observations on Trade in Commercial Services in Indo-Pacific: Implications for India
- In Economics
- 11:19 AM, Nov 30, 2017
- Mukul Asher

This article provides an overview of the level and the pattern of trade in commercial
services in select Indo-Pacific countries, and then draws implications for India.
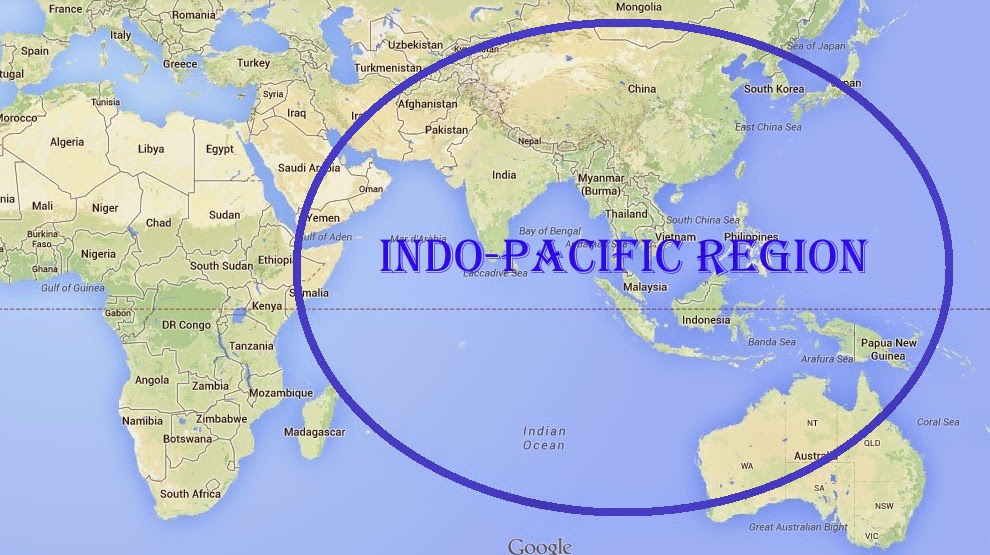
The term Indo-Pacific, is preferred, as compared for example to Asia-Pacific, it encompasses both the Indian and Pacific oceans. There is growing body of expert commentaries and official pronouncements recognizing that the term Indo-Pacific is better suited to address global economic and strategic engagements in the 21st century.
According to the World Trade Organization (WTO )( https://www.wto.org/english/res_e/statis_e/wts2017_e/wts2017_e.pdf), global trade in 2016 was USD 15.8 trillion, with merchandise trade accounting for 69.6 percent, and services 30.4 percent of the total. In value terms, during the 2010-16 period, the global merchandise trade exports and import each grew by an average of only 1.0 percent, with the corresponding figure for the services trade was 4.0 percent.
It is apparent that the services trade has been growing at a faster rate than the merchandise trade during the current decade. Services trade however has received relatively less attention of the researchers, policymakers, and of those who compile trade data than is the case with merchandise trade. As an example, data on bilateral trade in merchandise are easily available, but this is not the case with bilateral trade in services trade.
The relationship between world merchandise trade and GDP growth has also undergone a change in recent years. The ratio of world trade volume growth to GDP averaged 0.92 between 2012 and 2016; as compared to 2.08 during the 2007 to 2011 period. This ratio was even higher in the 1990s. Whether the recent trend in this ratio will continue in the coming years is at this point unclear. But at the minimum such a low ratio does suggest that merchandise export- led growth would become highly competitive and challenging in the coming years.
Select Aggregate Indicators of Services Trade
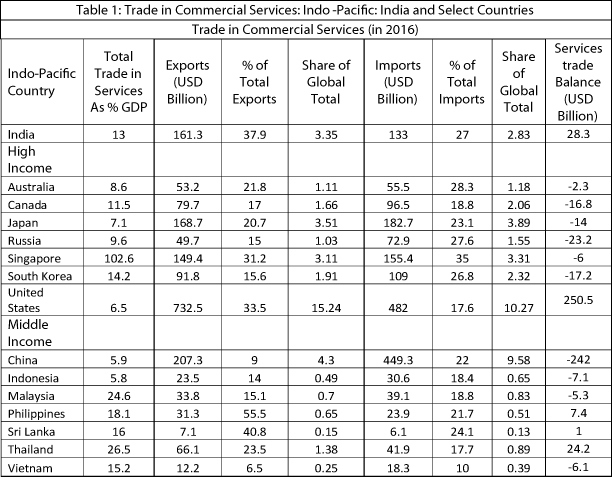
Table 1 provides select provides select aggregate indicators of trade in services in select Indo-Pacific countries. The base data for constructing the indicators are obtained from the World Trade Organization (WTO). (http://stat.wto.org/CountryProfile/WSDBCountryPFHome.aspx?Language=E) The data are for the year 2016.
- Services Trade As % GDP
The relative importance of services trade in GDP exhibits a wide range in the select Indo-Pacific countries. Singapore is exceptional in the sense that its services trade to GDP ratio exceeds 100 percent. In contrast, in the corresponding ratio in Indonesia (5.8), China (5.9), United States (6.5), Japan (7.1) is less 10 percent. Malaysia and Thailand, at around 25 percent, exhibit strong services trade.
India’s services to GDP ratio at 13 percent is relatively low, implying that the current service trade levels have relatively limited impact on India’s growth and employment dynamics.
- Services Exports
In the Indo-Pacific, United States exhibits had by far the highest services export at USD 732.5 billion, followed by China (USD 207.3 billion), Japan (USD 168.7 billion) and India (USD 161.3).
This Pattern is also reflected in their share of global services exports. This share is in double digits only for the United States (15.4 %). In relation to total exports (including merchandise trade), the share of services exports was highest in the Philippines (55.5 percent), followed by Sri Lanka, India, and the United States. For the top three countries, the high services trade share reflects relatively low levels of merchandise exports.
- Services Imports
The variance in imports of services in Indo-Pacific is relatively less than a exports. United State again accounts for the highest level of imports, with its share in global imports exceeding ten percent (10.27 percent). But it is closely followed by China, with global share of 9.58 percent. The other notable service importers, with global share in the brackets, are Japan (3.89 percent), Singapore (3.31 percent), and India (2.83 percent).
- Services Trade Balance
The highest positive services trade balance is by the United States (USD 250.5 billion). India (USD 28.3 billion) and Thailand (24.2 billion) also have significant positive trade balance in services.
China exhibits the highest negative services trade balance of USD 242 billion. The analysts however expect that as China’s reliance on global technology majors becomes less prominent, and as its business and technology services exports grow, the imbalance will sharply narrow and could even reverse in the coming years.
The negative services balance is also significant for Russia (USD 23.2 billion), South Korea (USD 17.2 billion), and Canada (USD 17.2 billion).
Among the select Indo-Pacific countries, only Thailand exhibited a surplus in both the merchandize and in services trade, reflecting its strength as an export-led economy. All other countries exhibited deficit in at least one of the two categories.
In 2016, the largest merchandise trade surplus was exhibited by China (USD 510.8 billion, equivalent to 4.6 percent of GDP), and the largest deficit by the United States (USD 796.8 billion, equivalent to 4.3 percent of GDP). In relation to GDP, Sri Lanka (10.8 percent), and the Philippines (9.8 percent) exhibited the largest merchandise trade deficits. In 2016, India exhibited the merchandise trade deficit of USD 95.1 billion, equivalent to 4.1 percent of GDP.
Implications for India
Implications meriting consideration of the trade policymakers and researchers in India emerging from the analysis of the trade in services in the Indo-Pacific countries may be summarized as follows.
- India has a surplus in services trade, but a much larger deficit in merchandise trade. How to expand surplus in services trade, while reducing merchandise trade deficit, even as global trading environment is subdued, and when other Indo-Pacific countries are undertaking their own reforms initiatives in these areas, requires a more strategic focus, and greater urgency in achieving results which are reflected in trade numbers.
- India needs to diversify and deepen its basket of services exports. The WTO data on services trade is disaggregated in to Transport, Travel, and Other Commercial Services (OCS). Among the three, in 2016. India had a large deficit (USD 32.8 billion) in Transport services. Exports of these services grew by only 2.0 percent per year during the 2010-16 period. Lack of competitiveness in Transport services is also reflected in exports of Goods-related services declining by 15 and 18 percent in 2015 and 2016 respectively, while imports increased sharply by 37 and 12 percent respectively.
India’s Sagarmala initiative (http://sagarmala.gov.in/), designed to better utilize the potential of “Blue Economy” revolving around oceans, coastal areas, and inland waterways, and connecting them with other transport modes, air, road, and railways, can help in narrowing the deficit in Transport services. But this desired outcome needs to be explicitly integrated in the Sagarmala initiative.
India had small surplus of USD 6.1 billion in Travel component of trade in services. As India’s outbound travel flows increase with rising incomes and changing preferences, even this surplus would be difficult to sustain without significantly increasing the export of travel services, including education-related inbound travel services.
As a comparison, Thailand exhibited a surplus of USD 41.6 billion in Travel services, equivalent to 10.2 percent of GDP. Malaysia’s surplus in Travel services of USD 6.9 billion exceeded India’s in 2016.
Greater competitiveness in-bound travel and associated services, including medical tourism, winter tourism, and export of education services, is therefore essential if India is to improve its balance in Travel services.
The third category Other Commercial Services (OCS) exhibited a surplus of USD 55.0 billion in 2016. This category includes informational technology enabled services, financial services and others. While India has performed reasonably well in IT enables services exports until now, challenges loom from grater protectionism in major markets, particularly the U.S. and Europe, from disruptive technologies, and from rapidly improving competitiveness of India’s competitors in the Indo-Pacific and Eastern Europe. So the extent to which India’s IT enabled industry achieves product, services, and geographic diversification, and is able to move up the value chain will impact on the exports of this category of services.
One of the areas where greater efforts are needed is undertaking greater share of international financial services domestically. While disaggregated data are not available, India’s imports of financial and related, such as legal, services could grow with rising investments in projects, and greater global outreach of Indian businesses. Initiatives such as GIFT (Gujarat International Financial Tec-City) (http://www.giftgujarat.in/), designed to complement Mumbai as a financial center, and perform some international financial services within the country, need to be more performance and outcome driven if the potential erosion in surplus in the OCS category is to be addressed.
- India needs to develop data base on bilateral trade in services, at least with major countries of relevance to services trade. The data should be timely and as disaggregated as possible.
As this is being undertaken by some countries, there is an existing body of knowledge to address technical and other issues in compiling such data.. As an example, Australia publishes a detailed bilateral trade in services document each year. Its 2015-16 Report (http://dfat.gov.au/about-us/publications/Documents/trade-in-services-australia-2016.pdf ) notes that in 2016, Australia’s exports of services to India was Australian $ 3.5 billion, and imports of services Australian $1.6 billion, with education related travel accounting for nearly three-fourths of Australia’s exports.
- international trade in services is inter-linked with trade in merchandise trade or goods trade. In framing strategy for the trade in services, these linkages need to be explicitly taken into account. Sagarmala initiative, and the potential benefits in logistics costs of the Goods and Services tax (GST) could be harnessed to improve India’s export competitiveness in both merchandise 6rade and in services trade. This also applies to trade in agricultural products. Globally, its share is around 10 percent, but it has been among the fastest rising component of global trade in recent years. India need to significantly improve its performance in agricultural products, as during the 2010-2016 period, India’s imports of these products increased at an annual rate of 10 percent, twice the rate for its exports.
The main theme arising from the analysis of services trade in the Indo Pacific region for India is to focus more explicitly on diversifying and deepening its services sector, particularly Travel and Transport components, and monitor outcomes and results reflected in India’s services trade.
Source: Constructed from the base data from the
World Trade Organization (WTO)
http://stat.wto.org/CountryProfile/WSDBCountryPFReporter.aspx?Language=E


Comments